From Google Analytics to Netlify Analytics
I decided to make the change recently to try out Netlify Analytics in place of Google Analytics. I was initially motivated to improve my website’s performance and eliminate trackers, but I’m also curious about how it is from the maintainer side. In this post, I’ll describe my motivations, what I did to get started, my initial impressions, and things I learned along the way.
What is Netlify Analytics?
Netlify is a cloud development platform for building and deploying websites with other serverless features available on top. In terms of where the company is, they’ve raised $212M in VC funding, they employ around 200 people and operate at ~$23M in annual revenue. The platform has great integrations, notably GitHub compatibility which allows you to easily connect code repositories and rebuild on pull requests, for example. Overall, I find it very convenient to use because of low-friction workflows for previewing incoming changes and quickly deploying.

In 2019, Netlify launched an Analytics service that helps you understand visits to web pages deployed on their platform. Because Netlify run the entire edge infrastructure they use to serve websites and applications, it can provide insights metrics directly from their infrastructure logs.
What’s the benefit of Netlify Analytics?
Insights and analytics are the best ways to understand who is visiting your website and what types of content is being viewed. The problem with Google Analytics is that there are clear privacy concerns with the amount and type of user data being collected, what is being done with it, who owns it and for how long.
There are many privacy-focused analytics tools available that offer better handling and control of user data. Matomo, Plausible, and Fathom are some of the most popular Google Analytics alternatives with a focus on privacy. The catch with all of these tools is they load client-side on the user’s browser when they visit your website and you still end up with a tracker.
Client-side tracking opens the door for device and user fingerprinting and other bad behavior. The number of people who use ad blockers is also growing year over year, completely eliminating the ability for trackers to collect user session data. If you run a technical blog, it would be safe to assume that over half of your readers have ad blockers installed. Privacy-focused analytics tools are a step in the right direction, but maybe user tracking can be fully avoided without sacrificing visibility on website analytics.
The bandwidth needed to load the analytics snippets results in a big performance hit. Google Analytics is added via a script which fetches tracking code from Google’s servers. The code that’s being run at page load can change dynamically depending on the types of data collection active. In my experience of using Google Analytics over the years, it seems that the footprint of the tracking code itself has increased considerably.
Measuring web performance with lighthouse
To measure user experience, I turned to Chrome’s lighthouse for page speed tests. I found their treemap to be a great way of inspecting and visualizing resource sizes beyond inspecting network requests in dev tools. This screenshot shows our baseline, with the JS resources by size from my home page as visualized in a treemap:
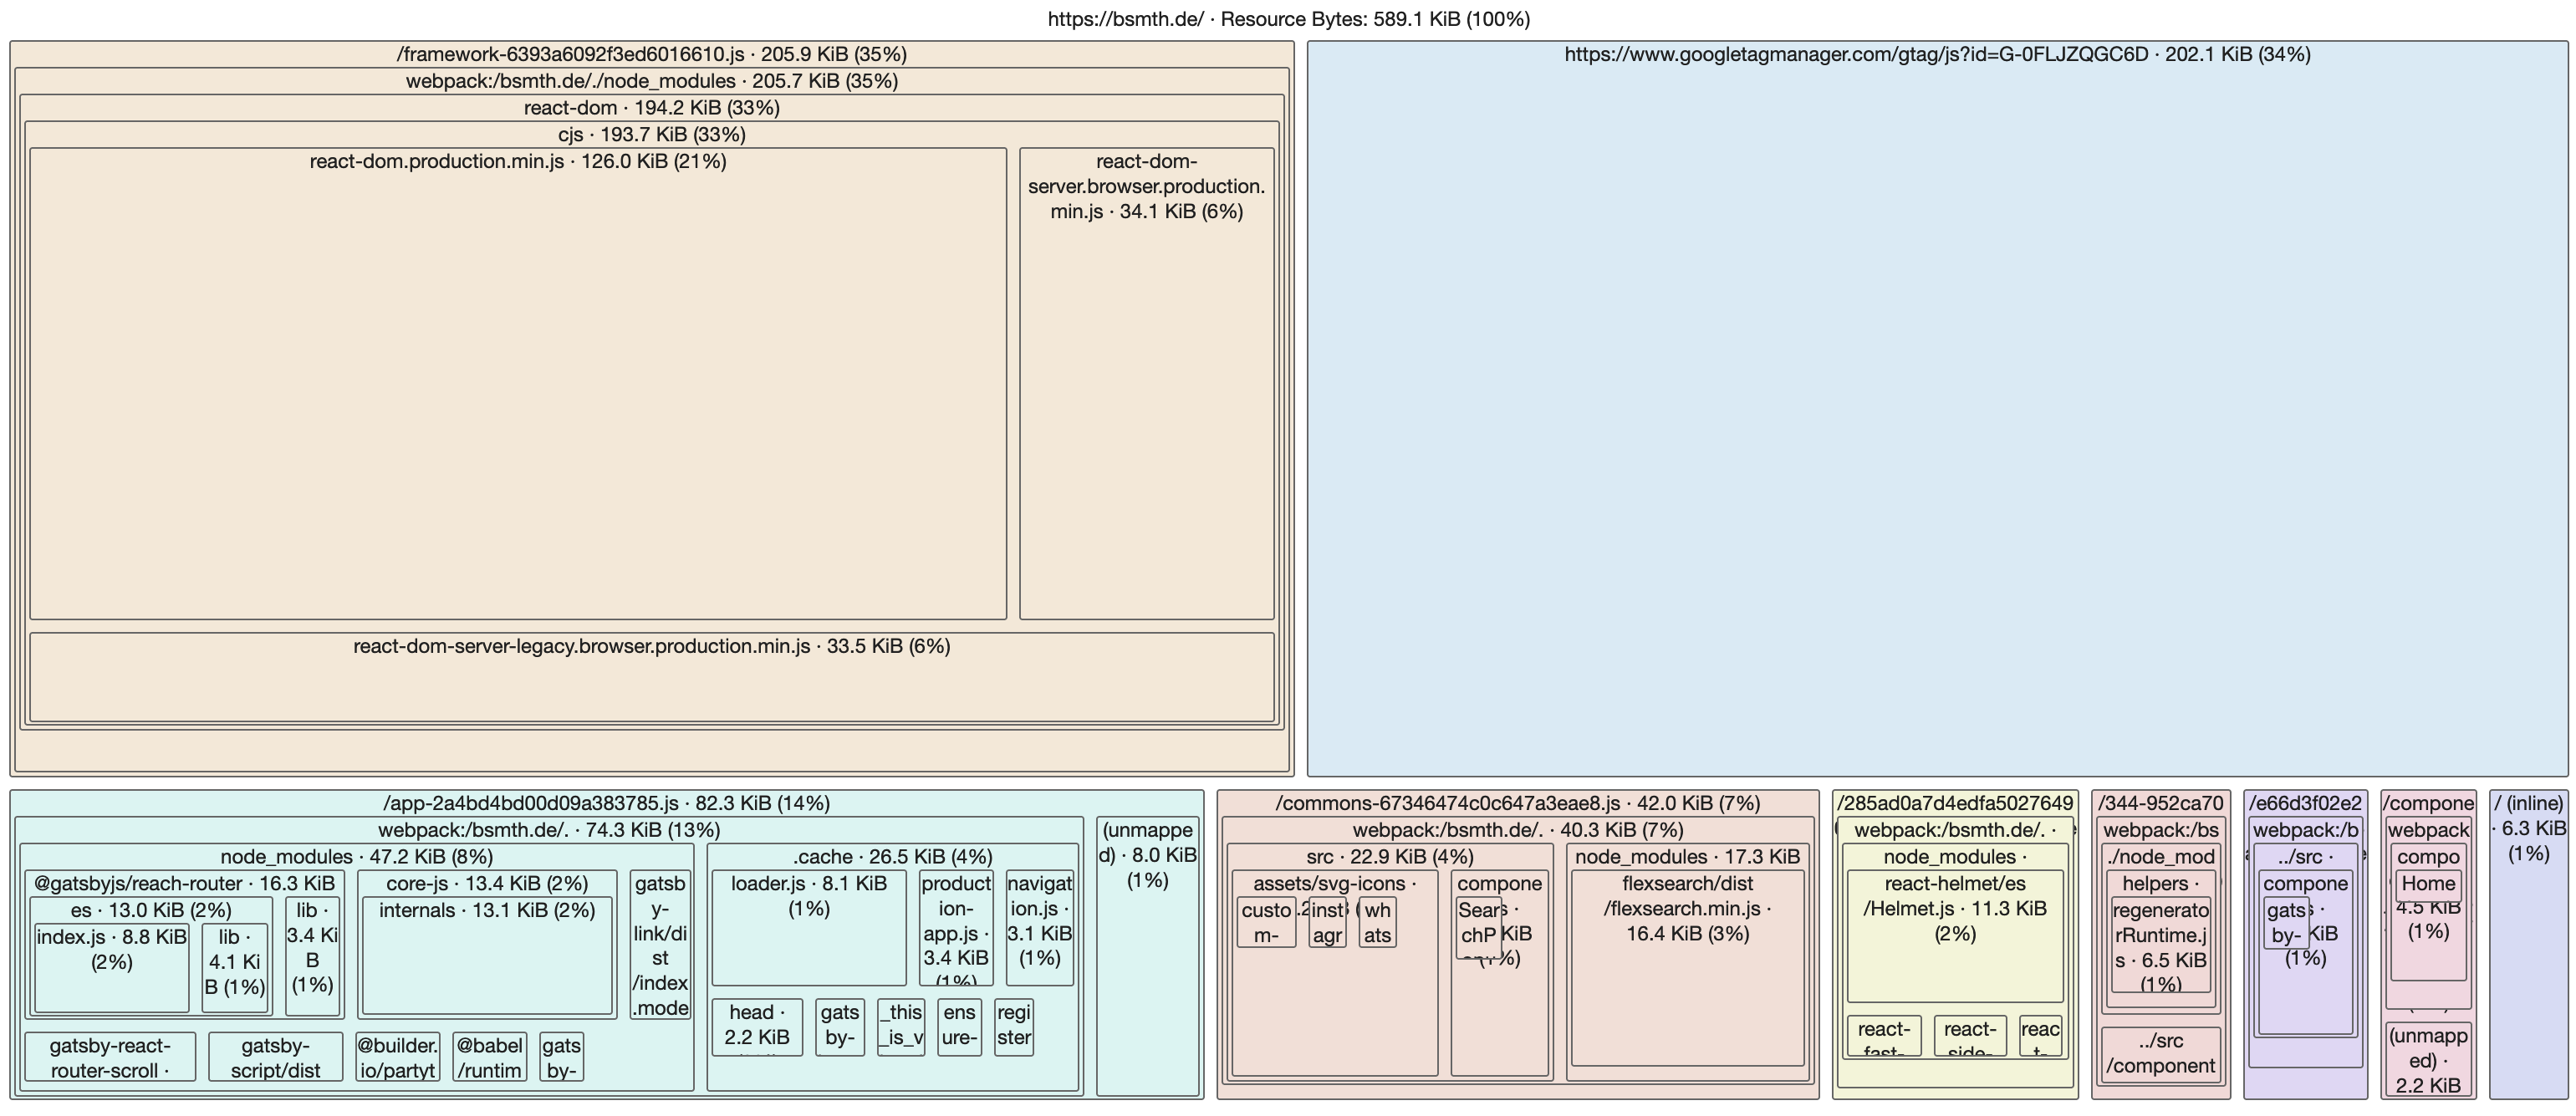
There’s a couple of things we can take away from this screenshot:
- 589 KB: the total size of JS resources
- 202 KB: the largest resource served is Google Analytics (top-right, blue rectangle)
- 0 visibility into what the GA script/tag contains
- All of the other resources look more-or-less essential, to be inspected later
Migrating from Google Analytics to Netlify Analytics
There’s not much that has to be done to enable Analytics on the Netlify admin panel. Analytics is not part of their free plan, but it can be enabled as a single addon for your account starting at $9 USD per month. After it’s enabled, there’s an Analytics tab in the top right corner of the Netlify admin panel.
The first view that you get is some basic metrics of pageviews over time:
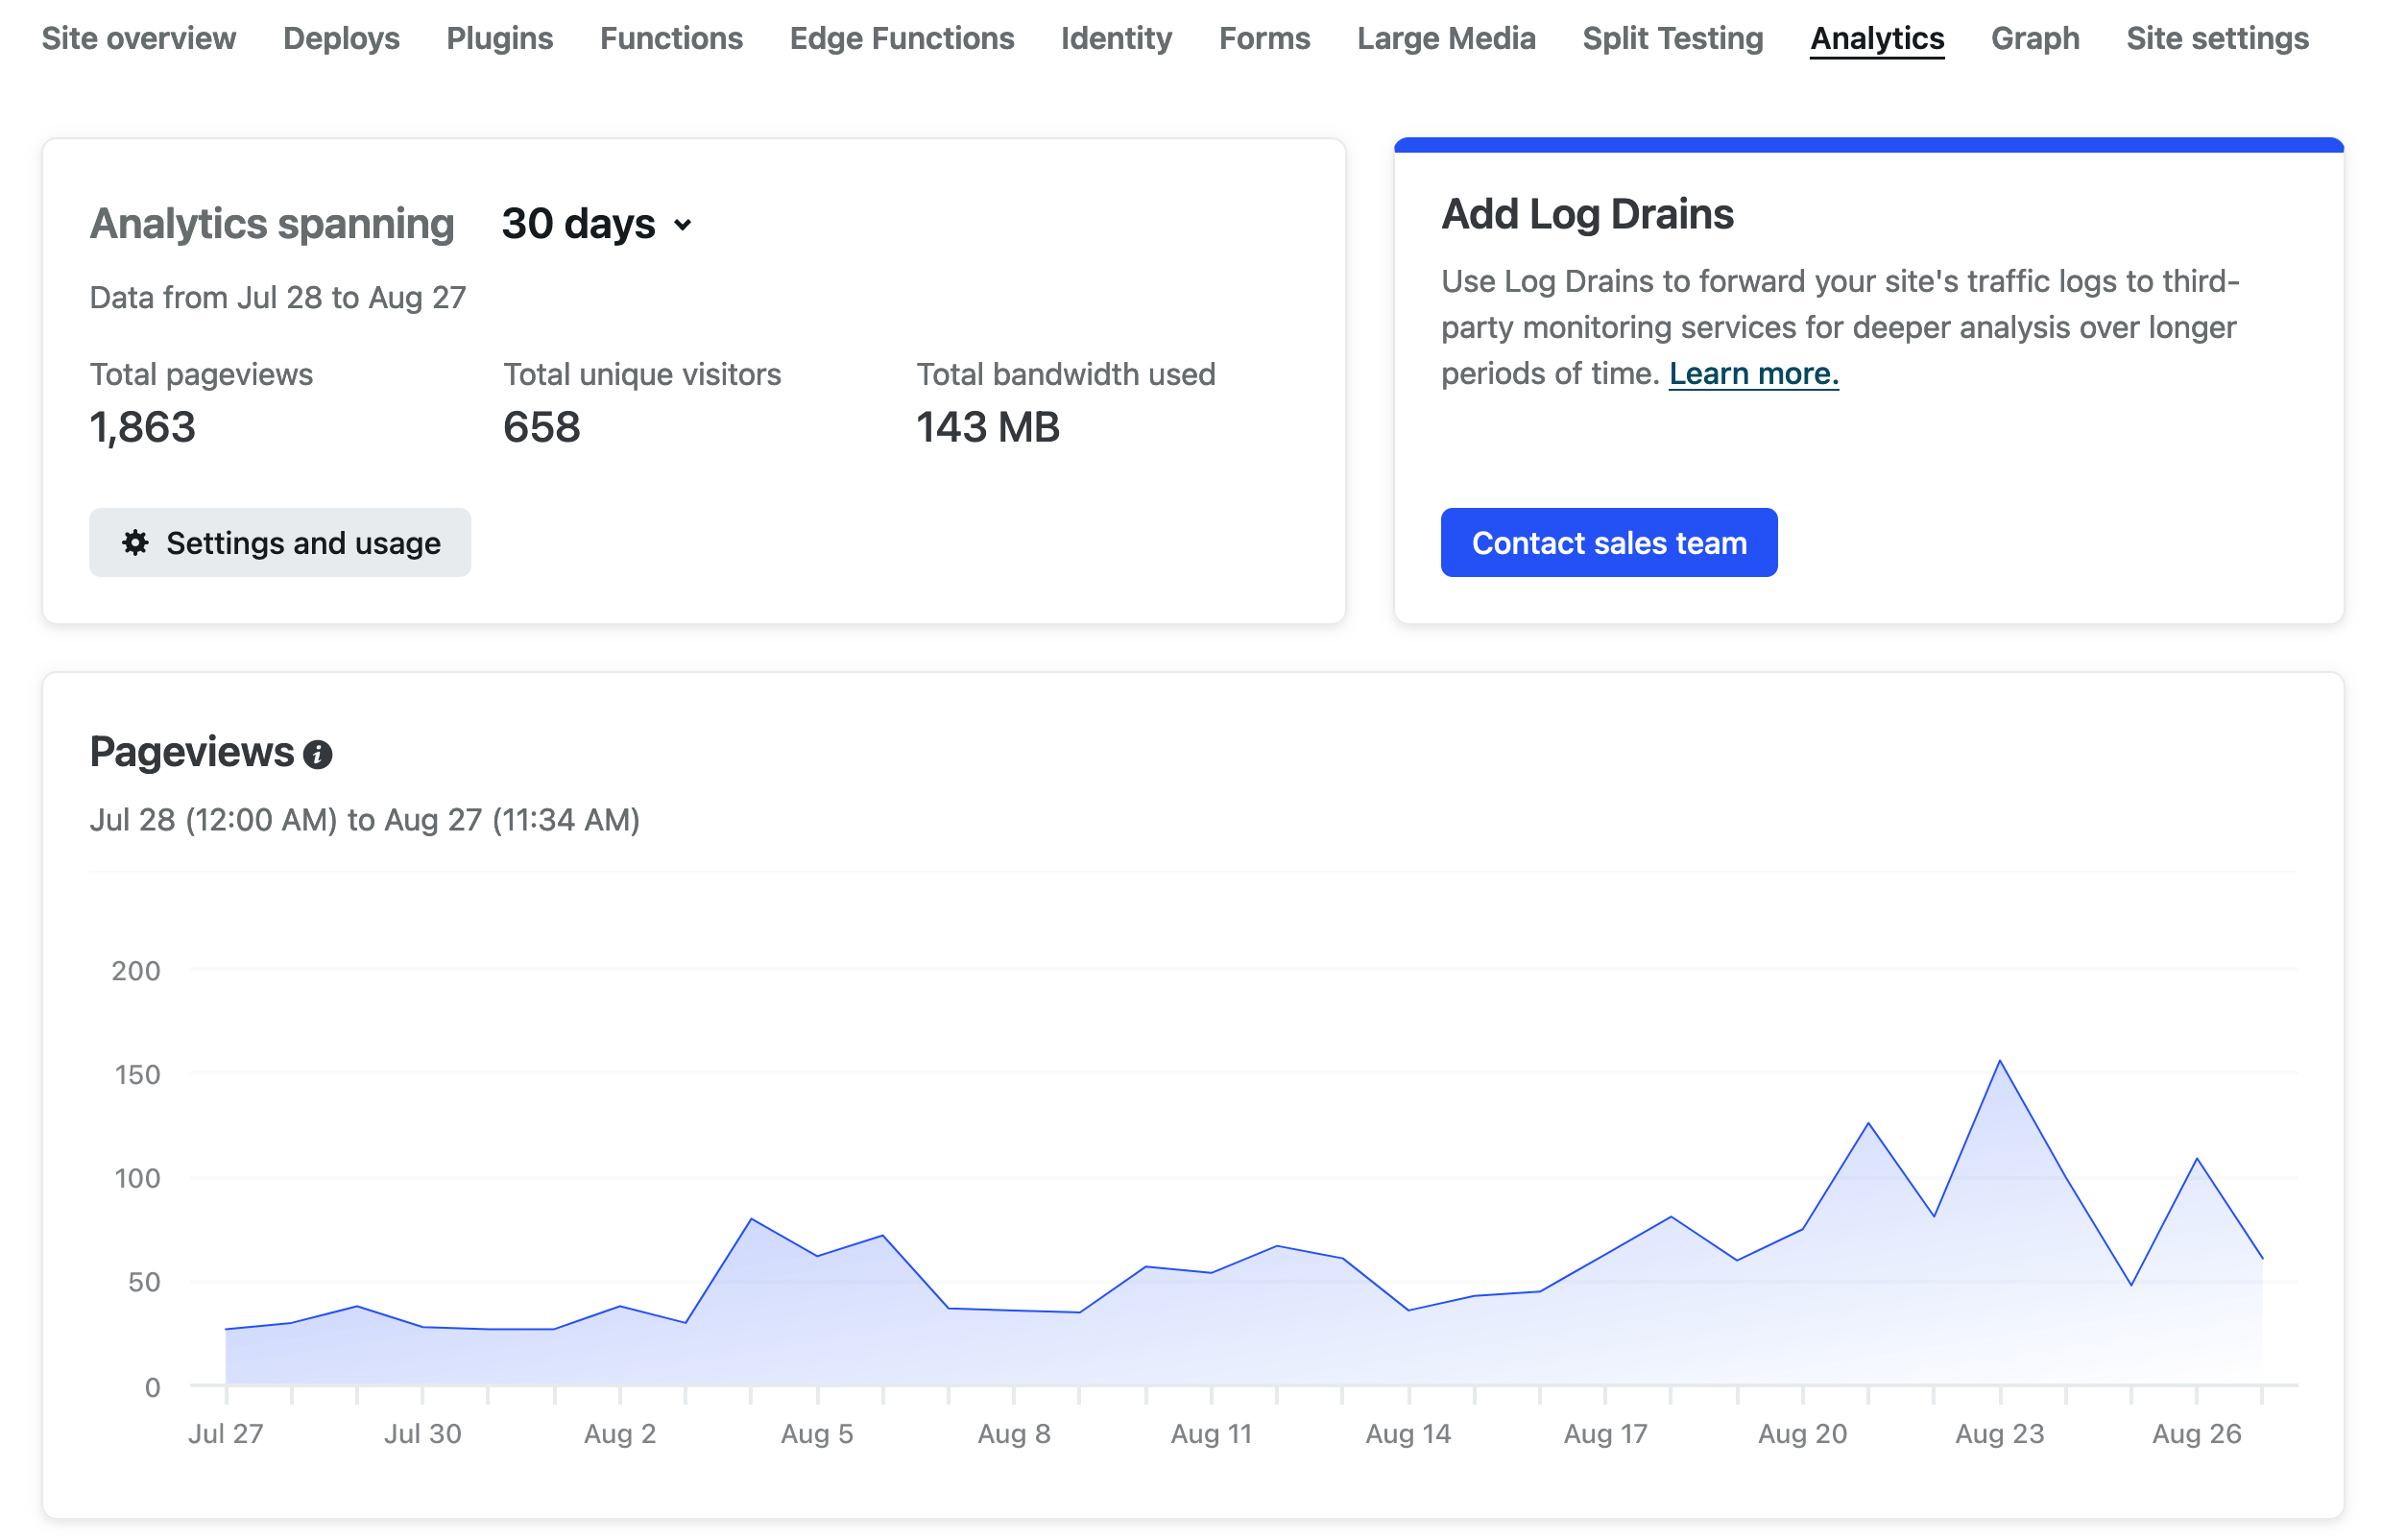
One thing you get from Netlify Analytics that you don’t get from client-side tracking is the top pages and resources not found. If we’re running our own server or cloud deploy, we would be able to see all network requests with much finer detail, but we’re balancing that with the simplicity of a completely managed service with Netlify.
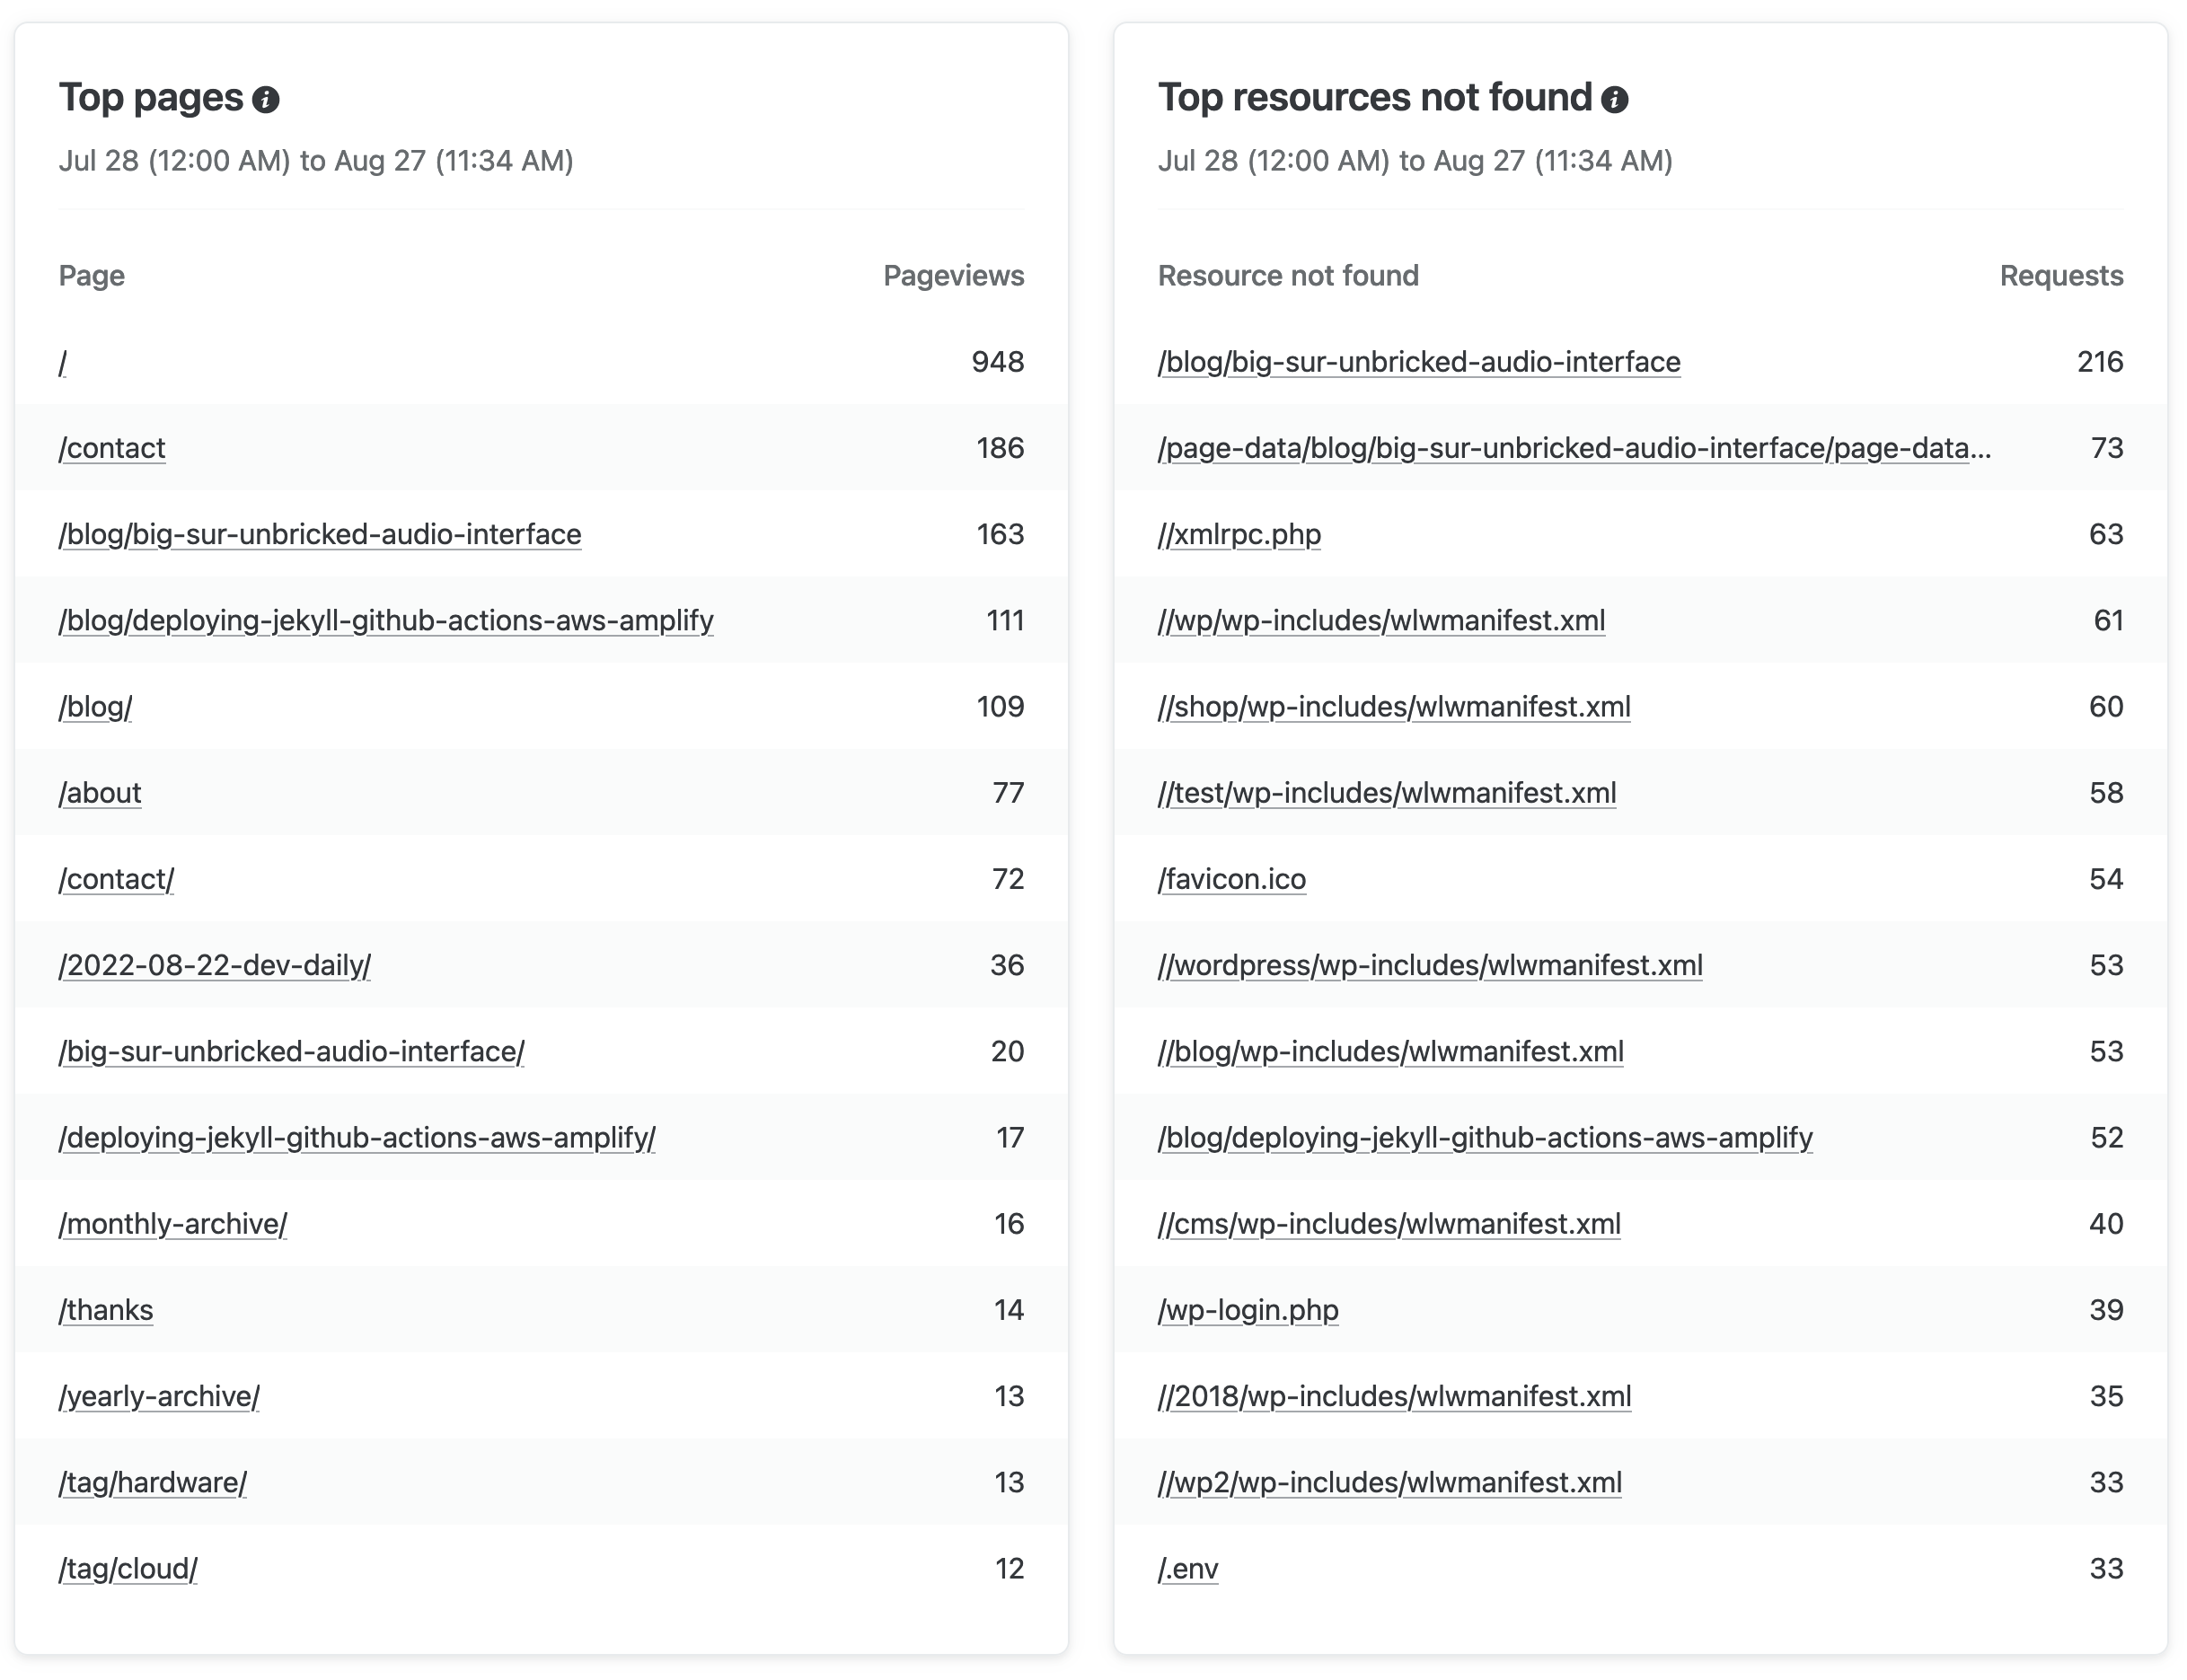
From the resources not found panel, there’s a few things we can take away:
- Bots seem to love looking for wordpress resources and logins
.envis what bots look for nowadays, showing how common it is for environment vars & secrets to land on the public internet- TODO: I need to set up redirects to new URLs since I redesigned the site
After Netlify’s Analytics were up and running, I removed the Google Analytics script from my pages and deployed to inspect the results. Here’s a look at the treemap view again after the migration:
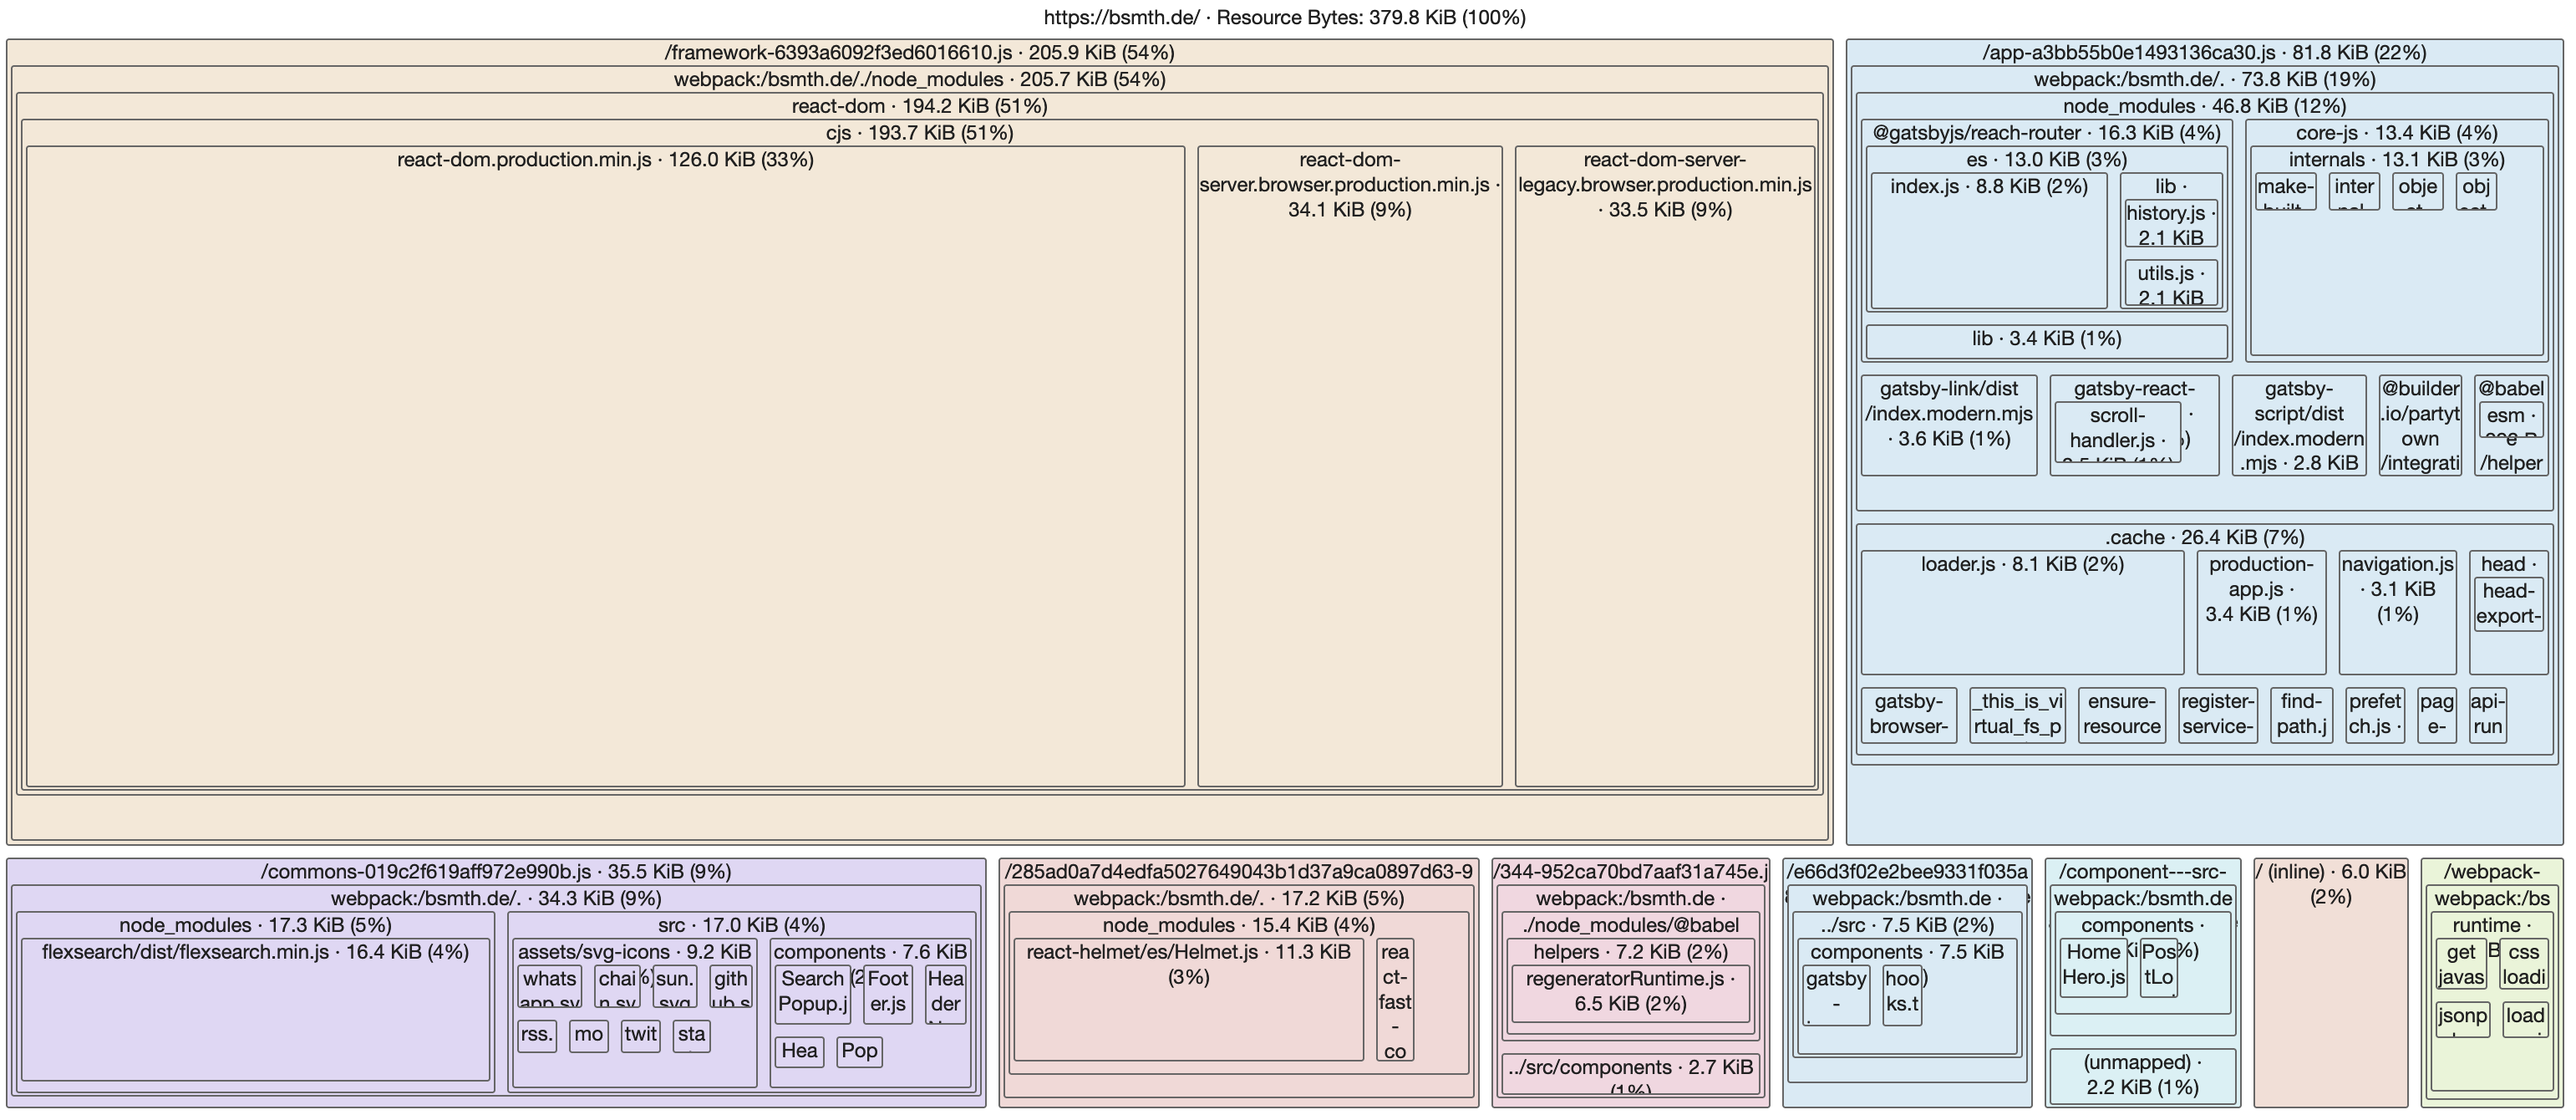
We’ve managed to achieve:
- 202 KB: savings after Google Analytics is removed :white_check_mark:
- ~35% decrease in page size :white_check_mark:
- 100% visibility and control over the content with no third-party tracking :white_check_mark:
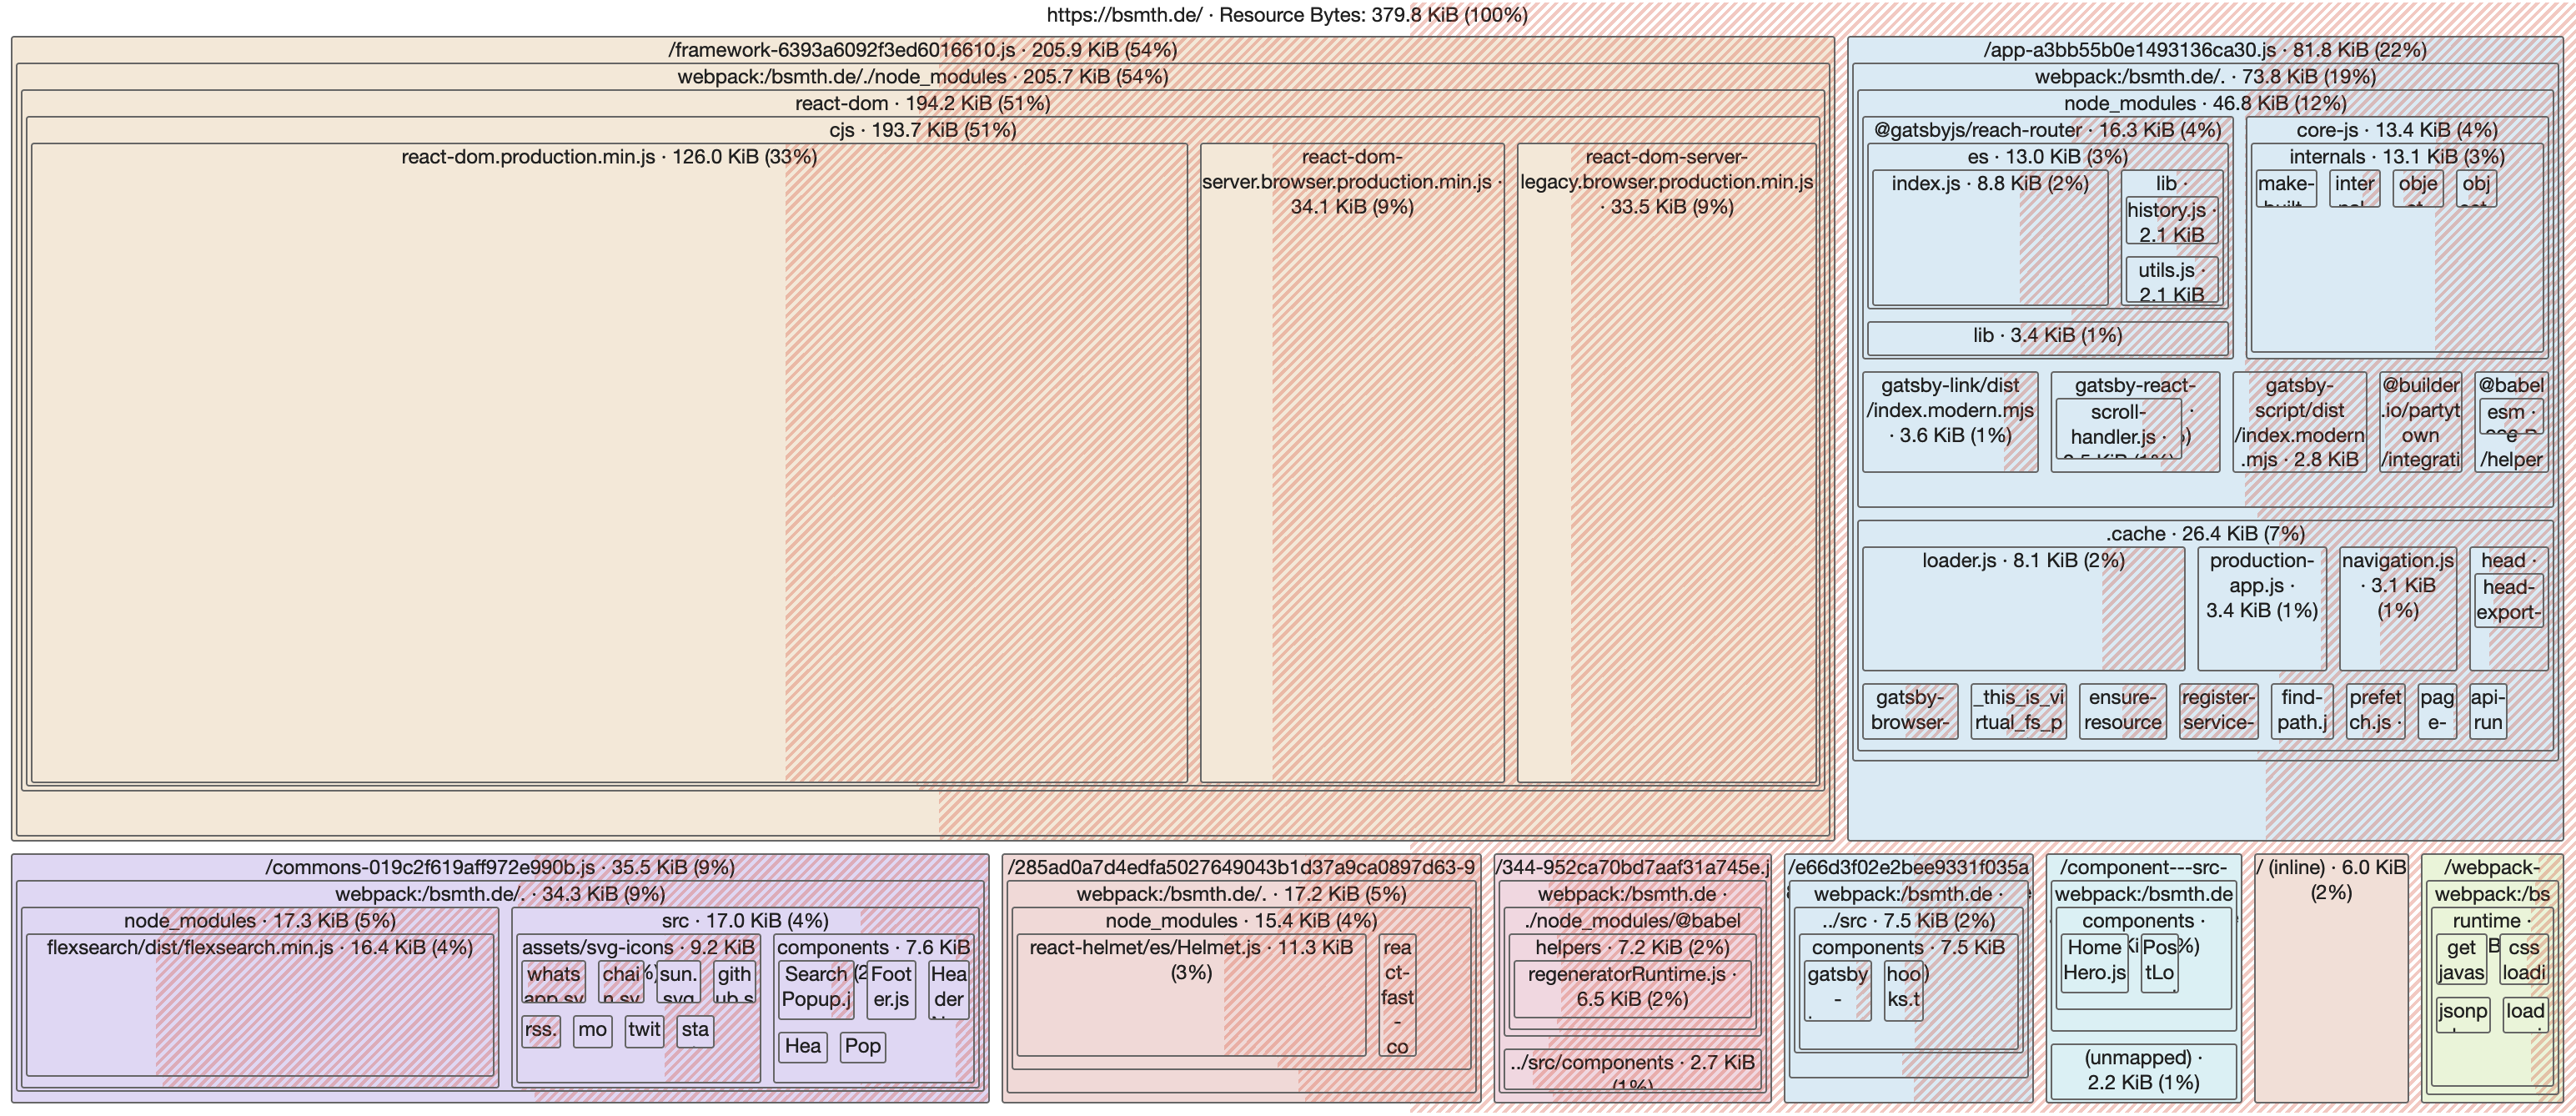
Incidentally, Chrome’s treemap has an Unused bytes view which shows that considerable parts of the production bundle is unused, but I have no idea what ‘unused’ means in this context or how to interpret the view. If you have some experience using this view, feel free to comment below with hints.
First impressions of Netlify Analytics
I like that I can get analytics inside a tool and admin panel that I’m already using for my ‘production deploys’. The performance benefits are great, with much faster page load times, fewer HTTP requests, and boiling less of the ocean in order to show cats with orbiting emojis. I also like that I can see what resources are missing, that helps with adding redirects for changed URLs.
The details of the analytics are not at the level you would get from Google Analytics and I was hoping for a bit more from a paid plan. I cannot create custom views, funnels, drill-down queries or any other standard view, but I think I have just enough information to make good choices.
The bot traffic is obviously not great that it is mixed in with real traffic and cannot be filtered out, but you are measuring visits from users that would otherwise be missing by the use of ad blockers. In this sense, we’re compensating in the other direction of having too much traffic shown than is realistic, but it has to be kept in mind.
I use this blog as a testbed for web development and I’m always looking to try out new tools to build, deploy and maintain websites. At first, I though $9 USD per month for very basic analytics was a bit steep, but it’s worth it for initial experimentation and the ability to share my experience. My wallet will take a hit for the sake of your privacy here.
My post-purchase rationalization is this: if you consider what you get with Netlify’s free plan with the amount of functionality that comes with it, then free plan, build minutes, previews, user management & analytics is a good deal.
Wrapping up
I have turned the switch from Google Analytics to Netlify Analytics as of a few hours ago, so I will likely revisit this topic in another post in future to see how the experience is longer-term. I’m happy with the results so far, and glad to have a site that is tracker-free, is privacy-friendly and is a bit more resource-efficient.
Thanks for reading! If you have any questions, comments, or suggestions, drop them below.